
Kupenga Kore
Net Zero
In 2018, a baseline emission inventory (metric tonnes of carbon dioxide equivalent) for the Murihiku Southland region was established. This highlighted that there are multiple contributions to the regional net emissions profile, including individuals, communities, businesses, and industries. Murihiku Southland’s net emission profile indicated that with 12% of New Zealand’s total land area and producing about 12% of New Zealand’s pastoral exports, Southland contributed only 9.5% of New Zealand’s net emissions.
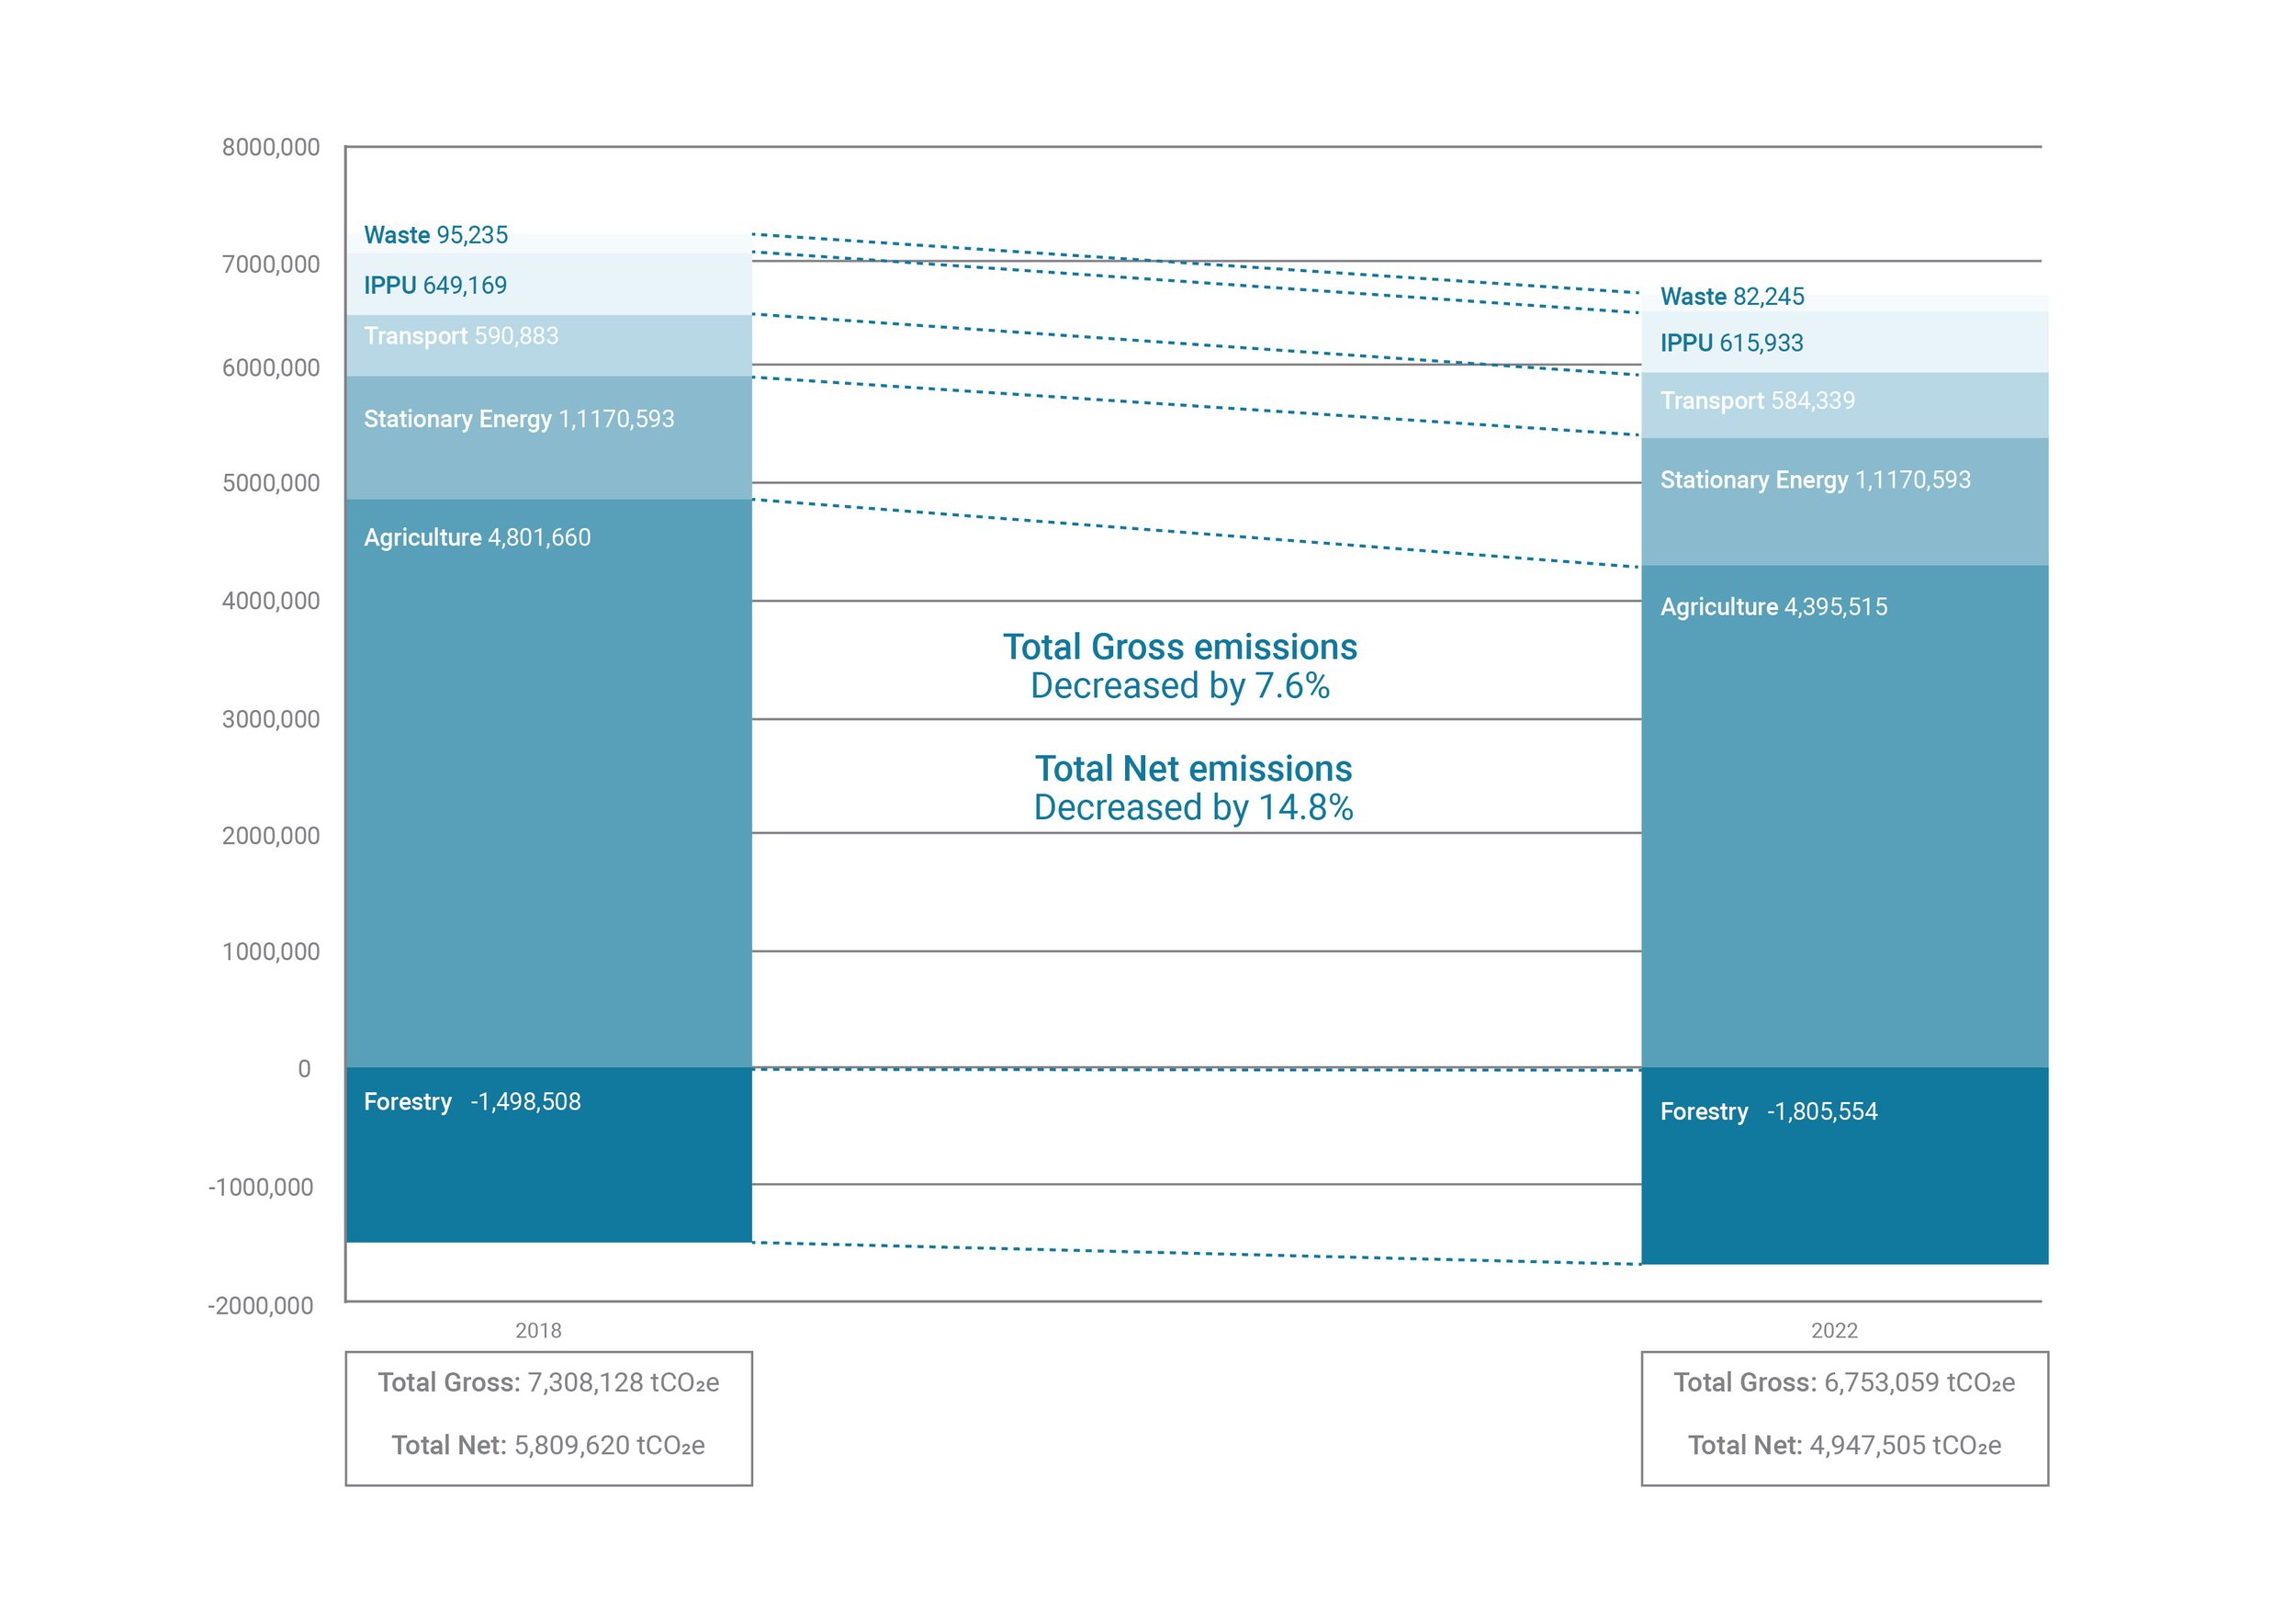
The inventory has been repeated annually by Great South with a progressive downward trend in regional net emissions compared to the 2018 baseline. The Southland Regional Greenhouse Gas Emissions Inventory for 2022 - Summary Report showed that Southland emissions decreased to 8.4% of New Zealand’s net emissions, which is a 14.8% reduction from the 2018 baseline – as seen in the below chart.
Below are some key indicators and associated commentary, with more information on data sources available in the Technical Glossary and via links to other dashboards.
Emissions overview and changes from 2022 and the 2018 baseline
Main points:


In gross terms, the total emissions for the Southland region have decreased by 555,069 tCO2e between 2018 and 2022.
The livestock units in Southland continues to decline which is reflective of the agriculture emissions in the Southland Region decreasing (446,320 tCO2e or 9.3%) – primarily due to:
o Dairy cattle numbers decreased by 44,864 or 7%
o Sheep numbers decreased by 455,618 or 12% in the Southland region.
o However, the number of beef cows increased by 11,385 or 7%
The stationary energy sector, the only sector in which total emissions increased in the previous year, also decreased this year (55,379 tCO2e or 4.7%). This is mainly due to the decarbonisation projects implemented throughout Southland and decrease in the emission factor of electricity caused by increase in hydro lake inflow.
Landfill Gas capture and use has decreased methane emissions by 11,745 tCO2e or 12.3%, mainly due to the significant increase in the recovery of methane at the Regional Landfill where collection efficiency increased from 30% to 75% gas recovery as site infrastructure was improved in 2021.
Forestry sequestration has increased by 307,046 tCO2e or 20.5%, primarily due to an increase in forest area.
Southland regions emissions (tCO2e) by sector (excluding forestry) for 2022

Break down of scopes:
1
Scope 1 emissions (GHG emissions from sources located within the Southland region boundary) account for most emissions in the Southland Region
2
Scope 2 emissions (GHG emissions occurring through the use of grid-supplied electricity, heat, steam and/or cooling within the Southland region boundary)
3
Scope 3 emissions (GHG emissions that are happening outside the Region but are driven by activities within the region) have been estimated for stationary energy and transport related activities.
Scope 2 (tC02e)
448,351
448,351
Scope 3 (tC02e)
51,990
120,472
172,462
Stationary energy
Transport
Waste
Agriculture**
Total
Total (tC02e)
1,115,215
584,009
83,556
2,549,786
4,947,505
% of Total
22.5%
11.8%
1.7%
51.6%
100%
Industrial Processes & Product uses*
614,939
614,939
12.4%
*Industrial Processes and Product Uses (IPPU)
** Agriculture, Forestry, and Other Land Use (AFOLU)
Southland region’s Net emissions by sector and scope for 2022
Sector
Scope 1 (tC02e)
614,874
463,537
83,556
2,549,786
4,326,692
Numbers of cattle and sheep in Southland 2018-2022
2019
181,921
658,626
3,407,144
2020
200,557
659,726
3,350,354
2021
203,928
642,690
3,395,748
2022
185,155
636,148
3,281,894
Total Change in stock numbers
+11,385
-44,864
-455,618
Livestock
Beef cattle
Dairy cattle
Sheep
2018
173,770
681,011
3,737,512
Key Findings
In 2022, Southland emitted a total gross of 6,132,246 tCO2e emissions under scope 1, with 448,351 tCO2e reported as scope 2 and 172,462 tCO2e reported as scope 3; All scopes combined total gross emissions of 6,753,059 tCO2e and net emissions of 4,947,505 tCO2e which is an overall reduction of 14.8%, from the 2018 baseline.
Agriculture is the largest contributing sector, accounting for 64.5% of total gross emissions.
The majority of this sector emissions is from dairy cows and sheep, accounting for about 74% of this sector.

The next largest emission sources are the stationary energy sector and the industrial processes and product use (IPPU) sector, which account for 17% and 9% of total gross emissions, respectively.
The emissions Southland Regional Development Agency 8 from the Stationary energy sector are largely attributed to the electricity use at Tiwai Smelter and fossil fuels used in milk process plants. More than 90% of the IPPU sector emissions were released as part of the aluminium smelting process in Tiwai smelter.


In the Stationary energy sector, aside from electricity, the majority comes from coal, accounting for about 46% of the total emissions from this sector. About 76% of total coal use was used in dairy processing followed by meat processing and other heating and boiler systems.
Favourable hydro conditions decreased NZ’s reliance on non-renewable sources for electricity generation in 2022. This change in power mix reduced emissions from electricity use by about 35% compared to 2021 and 8.7% compared to 2018.
To continue Emissions reduction, it is critical that the implementation of the Southland Murihiku Regional Energy Strategy 2022-2050 is supported, as this identifies the need for greater availability of renewable electricity, increased volumes of wood biomass fuels, and capture and use of methane as a direct substitute for LPG.


Gross emissions in Southland have been steadily decreasing since 2018 which is the baseline from which all emissions are measured. Total emissions for 2018 and 2022 were 7,308,128 tCO2e and 6,753,059 tCO2e respectively.
As carbon emissions in stationary energy and Industrial Processes and Product Uses (IPPU) sectors are mostly emitted from Tiwai Smelter and Fonterra’s Edendale operations, the forward planning of the decarbonisation of these industries is very important.