
Kupenga Kore
Net Zero
In 2018, a baseline emission inventory (metric tonnes of carbon dioxide equivalent) for the Murihiku Southland region was established. This highlighted that there are multiple contributions to the regional net emissions profile, including individuals, communities, businesses, and industries.
Murihiku Southland’s net emission profile indicated that with 12% of New Zealand’s total land area and producing about 12% of New Zealand’s pastoral exports, Southland contributed only 9.5% of New Zealand’s net emissions.
The inventory has been repeated annually by Great South with a progressive downward trend in regional net emissions compared to the 2018 baseline. The Southland Regional Greenhouse Gas Emissions Inventory for 2022 - Summary Report showed that Southland emissions decreased to 8.4% of New Zealand’s net emissions, which is a 14.8% reduction from the 2018 baseline. The 2024 Emission have been calculated and are shown below.
Below are some key indicators and associated commentary.
Emissions overview and changes from 2024 and the 2018 baseline
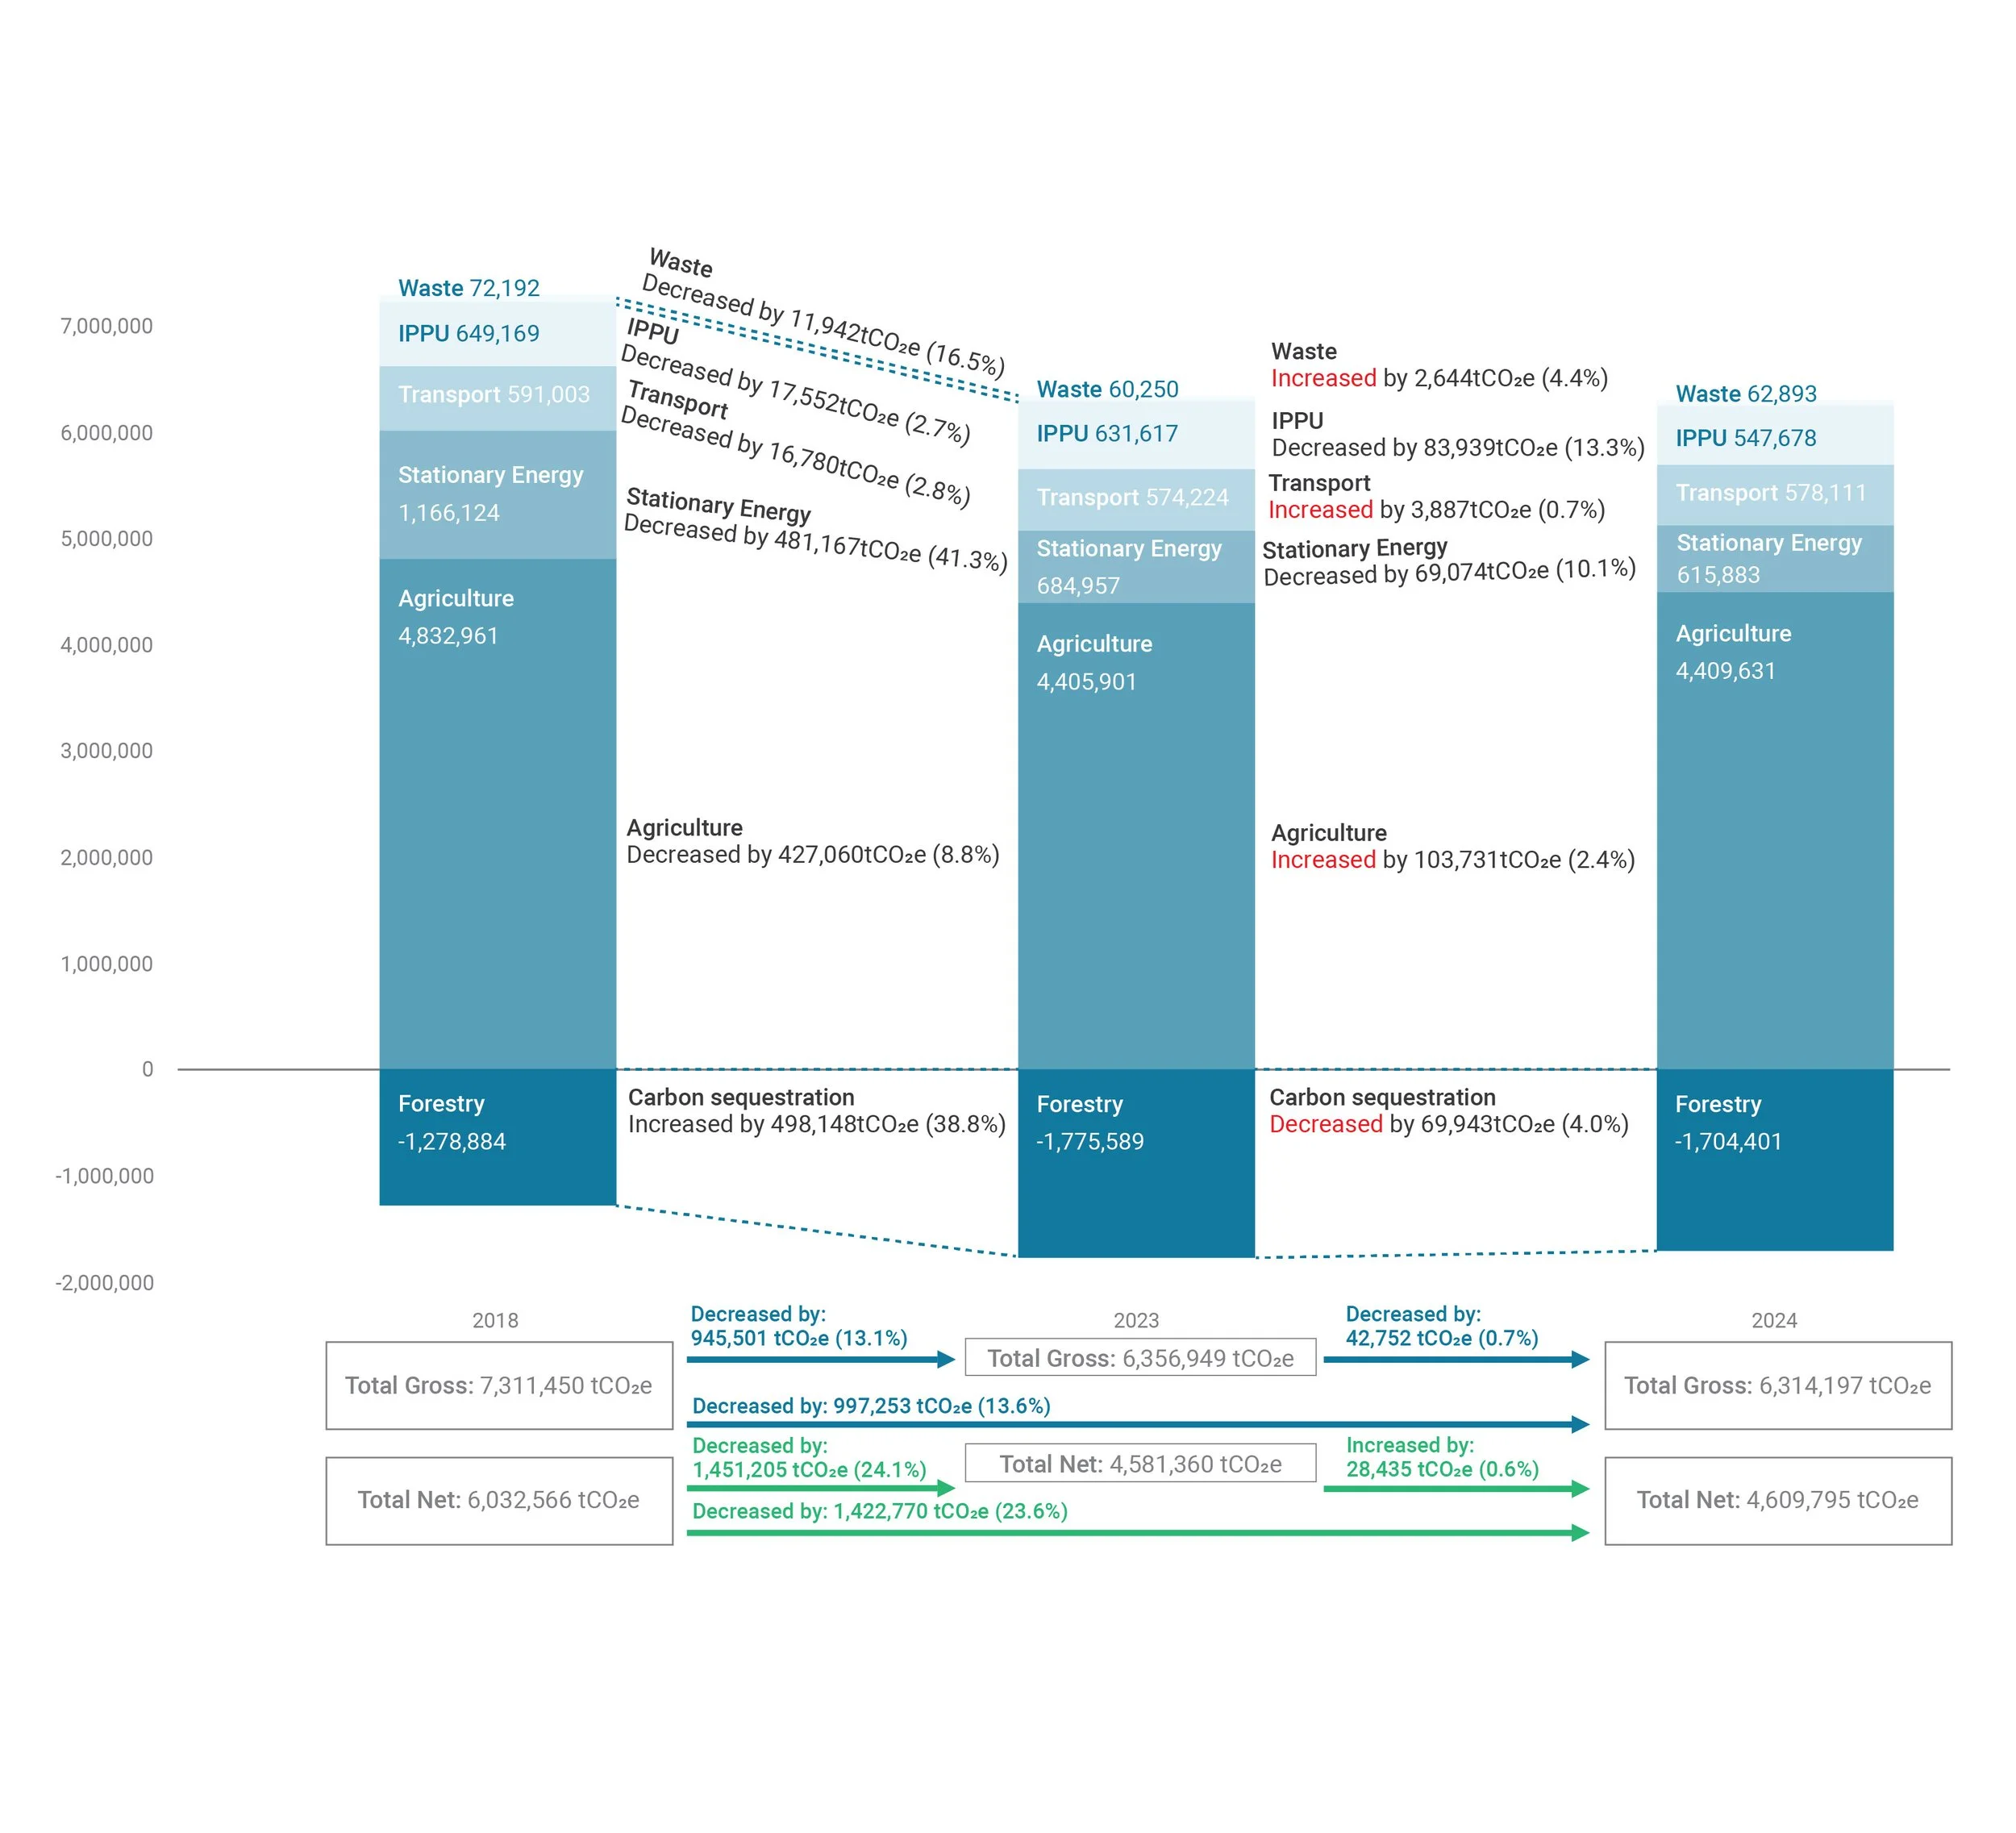
Main points:
The total gross emissions have decreased by 997,253 tCO₂e between 2018 and 2024.

Agriculture is the second-largest contributor to emissions reductions, with a decrease of 323,329 tCO₂e. This reduction is mainly driven by a significant decline in sheep numbers (down by 697,043 or 19%) and a reduction in fertiliser use (down by 63,277 tonnes or 23%) in the Southland region. Emissions from dairy cows had been on a steady downward trend up to 2022; however, this trend reversed in 2023 as rising milk prices contributed to an increase in dairy cow emissions. The renewed upward trajectory is largely attributed to higher global butter demand, which drove up butter prices and improved farm‑gate profitability—identified as a key factor behind the increase in dairy cow numbers.

Stationary energy emissions have decreased the most (550,241 tCO₂e). The primary driver of this reduction is the Government’s decision to set the electricity emission factor for NZAS to zero, which significantly reduced emissions attributed to electricity use and T&D losses at the Tiwai aluminium smelter. A further contribution came from the substantial reduction in coal consumption, supported by successful boiler conversion initiatives funded through the Government Investment in Decarbonising Industry (GIDI) Fund, the State Sector Decarbonisation Fund, and the Government Waihōpai / Invercargill Decarbonisation Contestable Fund.

Waste emissions have decreased by 9,299 tCO₂e, mainly due to the significant increase in the LFG collection efficiency from 30% to 75% as the facilities of AB Lime landfill were improved in 2021.

Forestry sequestration has increased by 425,517 tCO₂e, primarily due to an increase in plantation.

In the transport sector, emissions from all subsectors except on-road transport increased. However, because on-road transport—which accounts for around 65% of the sector’s total emissions—recorded a decrease, overall emissions from the sector fell by 12,893 tCO₂e. Since the end of the COVID pandemic, emissions have continued to decline despite increases in the number of registered vehicles and total distance travelled. This trend is largely driven by the growing share of fuel‑efficient and low‑emission vehicles, including hybrid vehicles and electric vehicles (EVs).

Southland regions emissions (tCO2e) by sector (excluding forestry) for 2024

Break down of scopes:
Scope 1 emissions (GHG emissions from sources located within the Southland region boundary) account for most emissions in the Southland Region
1
Scope 2 emissions (GHG emissions occurring through the use of grid-supplied electricity, heat, steam and/or cooling within the Southland region boundary)
2
Scope 3 emissions (GHG emissions that are happening outside the Region but are driven by activities within the region) have been estimated for stationary energy and transport related activities.
3
Southland region’s net emissions by sector and scope for 2024
| Sector | Scope 1 (tC02e) | Scope 2 (tC02e) | Scope 3 (tC02e) | Total (tC02e) | % of Total |
|---|---|---|---|---|---|
| Stationary energy | 482,297 | 124,145 | 9,441 | 615,883 | 13.4% |
| Transport | 441,090 | 137,011 | 578,111 | 12.5% | |
| Industrial Processes & Product uses* | 547,678 | 547,678 | 11.9% | ||
| Waste | 62,893 | 62,893 | 1.4% | ||
| Agriculture** | 2,805,230 | 2,805,230 | 60.9% | ||
| Total | 4,339,198 | 125,145 | 146,453 | 4,609,795 | 100% |
*Industrial Processes and Product Uses (IPPU)
** Agriculture, Forestry, and Other Land Use (AFOLU)
Numbers of cattle and sheep in Southland 2018-2024
| Livestock | 2018 | 2019 | 2023 | 2024 | Total change in stock numbers |
|---|---|---|---|---|---|
| Beef cattle | 173,770 | 181,921 | 184,702 | 193,083 | +19,313 |
| Dairy cattle | 681,011 | 658,626 | 661,014 | 686,069 | +5,058 |
| Sheep | 3,737,512 | 3,407,144 | 3,069,684 | 3,040,470 | -697,042 |
| Fertiliser use (ton) | 253,133 | 248,891 | 194,876 | 211,013 | -42,120 |
Key Findings
In 2024, Southland emitted a total gross of 6,043,599 tCO2e emissions under scope 1, with 124,145 tCO2e reported as scope 2 and 146,453 tCO2e reported as scope 3; All scopes combined total gross emissions of 6,314,197 tCO2e and net emissions of 4,609,795 tCO2e which is an overall reduction of 23.6%, from the 2018 baseline.

Agriculture is the largest contributing sector, accounting for 71.4% of total gross emissions. The majority of this sector emissions is from dairy cows and sheep, accounting for about 76% of this sector.
The next largest emission sources are found in the stationary energy sector. Between 2018 and 2020, emissions from NZAS electricity consumption and fossil‑fuel use at milk processing plants accounted for approximately 42% and 28%, respectively, of total stationary energy emissions, together representing the majority of the sector. However, from 2021 onward, the electricity emission factor applied to NZAS was set to zero, leading to a substantial reduction in stationary energy emissions. As a result of this change, fossil‑fuel use at milk processing plants has become the dominant contributor within the sector, accounting for roughly half of stationary energy emissions since 2021.


In the stationary energy sector, coal is the largest source of emissions. Coal accounted for around 72% of the sector’s emissions in the previous year, but this proportion has fallen to approximately 63% due to the conversion of coal‑fired boilers to renewable‑energy systems at facilities such as Mataura Valley Milk and Southland Hospital. Most coal use continues to be driven by dairy processing, followed by meat processing and other industrial heating and boiler operations.
In 2024, wind, solar, and geothermal generation all increased; however, hydro generation dropped significantly due to dry climate conditions. As a result, coal‑fired generation rose to help maintain supply contributing to a sharp increase in the electricity emission factor. Compared with 2023, the electricity emission factor increased by approximately 39%. Although electricity consumption grew by only around 11% in 2024, emissions from electricity use increased by about 54% as a result of the higher emission factor.in New Zealand 2025
To continue Emissions reduction, it is critical that the implementation of the Southland Murihiku Regional Energy Strategy 2022-2050 is supported, as this identifies the need for greater availability of renewable electricity, increased volumes of wood biomass fuels, and capture and use of methane as a direct substitute for LPG.
Gross emissions in Southland have been decreasing since 2018 which is the baseline from which all emissions are measured. Total emissions for 2018 and 2024 were 7,311,450 tCO2e and 6,314,197 tCO2e respectively.
As carbon emissions in stationary energy and Industrial Processes and Product Uses (IPPU) sectors are mostly emitted from Tiwai Smelter and Fonterra’s Edendale operations, the forward planning of the decarbonisation of these industries is very important.
Historical Recalculation
As part of ongoing improvements to the Southland emissions inventory, two historical recalculations have been applied to enhance accuracy and ensure consistency across the time series.
NZAS Electricity Emissions Adjustment
In previous inventories, electricity consumption at the New Zealand Aluminum Smelter (NZAS) was calculated using the national average electricity emission factor, and this approach was applied from the 2018 inventory onward.
In 2021, the New Zealand Government formally confirmed that the electricity supplied to NZAS is treated as having zero emissions, due to its dedicated renewable electricity generation arrangement.
To reflect this, historical NZAS electricity emissions have been recalculated using a 0 tCO₂-e emission factor from 2021 onward, ensuring the inventory aligns with the officially recognised emission treatment for NZAS electricity use.Wood Harvest Area Methodology Update
A second recalculation was undertaken to improve the estimation of wood harvest area in Southland. Previously, harvest area was derived using MPI’s National Exotic Forest Description (NEFD) dataset. The method assumed that one-fifth of the area in the 1-5 year age band represented newly planted forest area each year. If total forest area did not change from the previous year, this same area was assumed to approximate the harvest area. Where area changes occurred, the change was subtracted from the 1-5 year age band before applying the one-fifth assumption.
Review of this method indicated potential inaccuracies, particularly in years when planting and harvesting patterns differed from NEFD assumptions.
A new, more representative method has now been adopted. Beginning with the 2024 inventory, the wood harvest area is estimated using export volume data from South Port, including exported logs, wood chips, and sawn timber. These volumes are converted to an estimated harvest area, providing a more direct reflection of actual forestry activity in the region.
Historical results have been recalculated using this updated approach to maintain consistency across the full time series.